
BUSINESS INTELLIGENCE
Data visualization solution for business
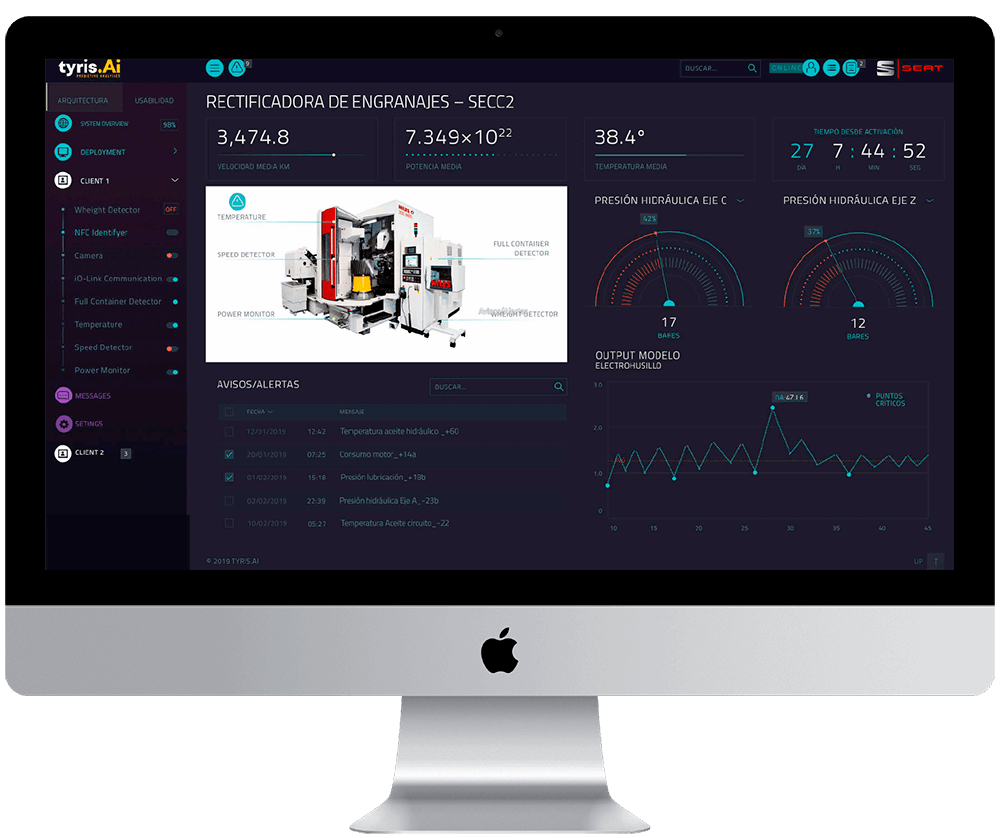
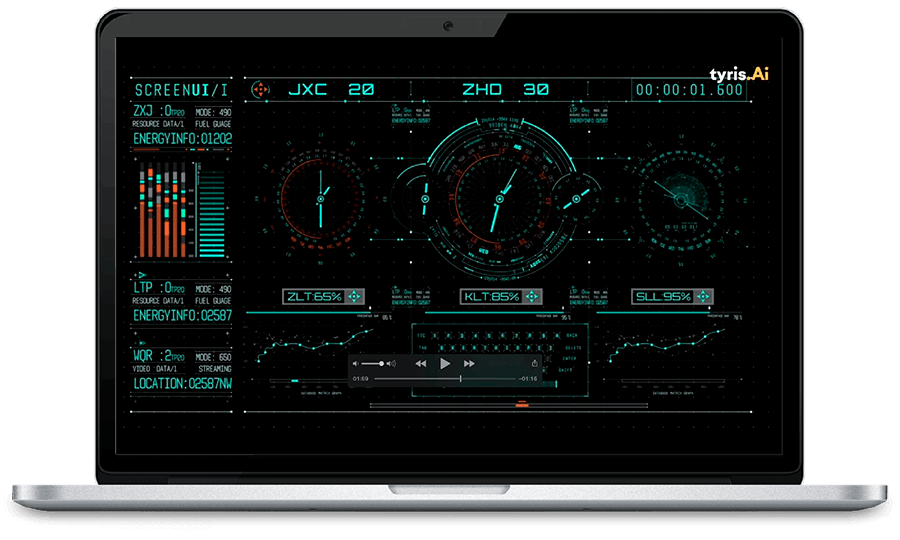
Tyris BI is Tyris Software’s data visualization solution management for business, specifically designed to work on Big Data architectures. Designed to meet the new needs of markets, provides a great flexibility and adaptability to any infrastructure.
Our BI dashboards enable advanced statistical and predictive analysis of all business information to assist in strategic decision making. These intelligent algorithms make an automatic selection of critical variables that a human would not be able to visualize with conventional tools.
data visualization solution
data visualization solutions
Optimal & user-friendly
displays
designed based on INTERACTIVE GRAPHICS, in a CUSTOMIZABLE ENVIRONMENT that enhances the EXPLORATION OF DATA.
VERSATILE
IMPLANTMENT
EASY AND FAST DEPLOYMENT ON PARTICULAR CUSTOMER INFRASTRUCTURES. MAXIMUM ADAPTATION TO THE PROCESS
BIG DATA
ARCHITECTURES
SPECIFICALLY DESIGNED TO INGEST LARGE VOLUMES OF DATA
SMART
PROCESSORS
business
We offer customized data visualization solution for the display of business activity data both through screens and mobile devices.
Some of our most important branches of action are:

GATHERS ALL THE VARIABLES OF THE LOGISTICS CHAIN, LOCATION AND TRAFFIC OF CONTAINERS, ENERGY EFFICIENCY, EVOLUTION OF COMPETITION, INCIDENT REPORTING, EFFICIENCY OF OPERATIONS…

PRODUCTION PLANNING, LOGISTICS CHAIN OPTIMISATION, EFFICIENCY OF PRODUCTION RESOURCES, ASSIGNMENT OF WORK ORDERS ADAPTED TO THE OPERATOR’S SKILLS…

DATA DISPLAY FOR THE INFRASTRUCTURES MAINTENANCE, TREND ANALYSIS, FORECAST OF STATE INDICATORS EVOLUTION, DISPLAY OF MAINTENANCE REPORTS…

USER-CENTERED MULTIPLE DATA SOURCES INTEGRATION, OPEN DATA PLATFORMS CONNECTION, TRANSPARENCY PORTAL, IOT NETWORK CONNECTION…
To innovate early means taking risks. Not doing it on time is even riskier.
It is time to bet on BI technologies that allow us to advance in our objectives, analyzing the data we have for definir a strategy.
We must incorporate other data sources and improve our understanding of our customers, our competitors and our own strengths and weaknesses.
This is how our data visualization solution management works.
01
Data Analysis
provides: ORDER, HIERARCHY AND PRIORITIZATION IN YOUR COMPANY DATA

02
ability to respond
PRIORITIZES INFORMATION TO AVOID UNEXPECTED SURPRISES

03
Visualising Goals
SPEEDS UP DECISION MAKING
